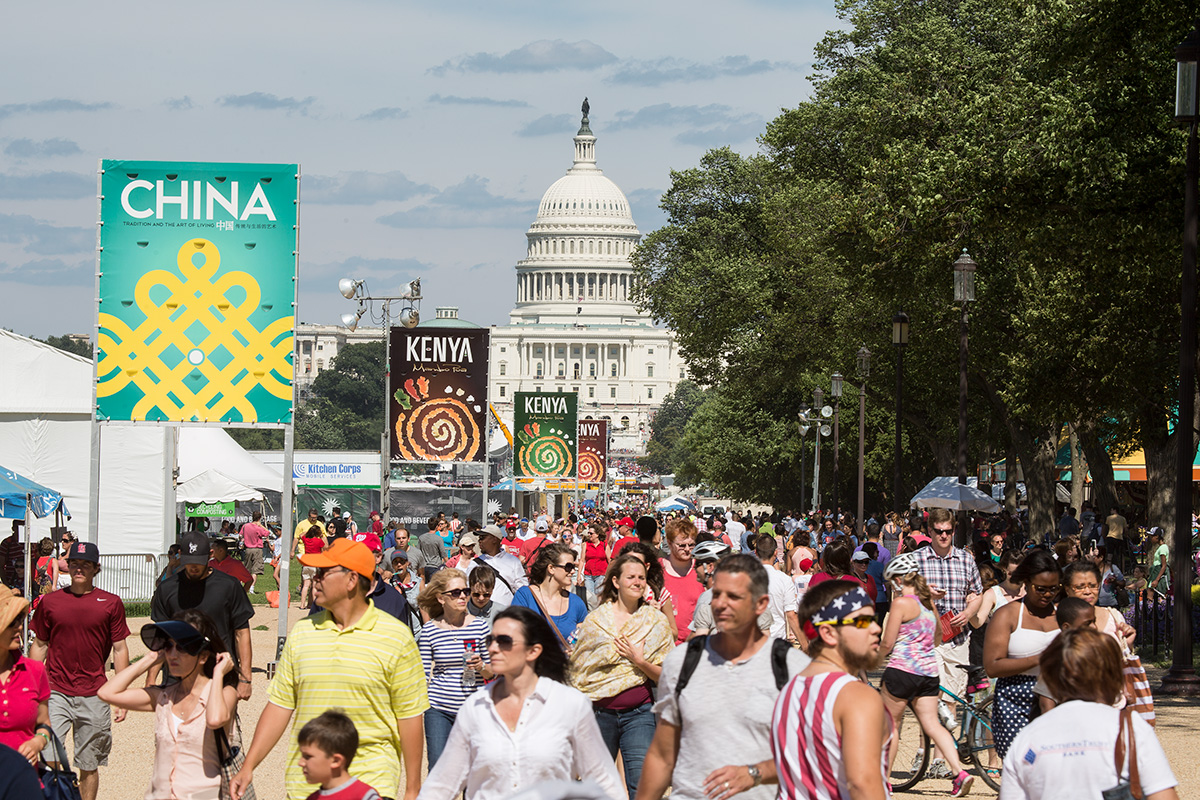
Since 2013, the collection of surveys has been done electronically, this year via four tablets. The change from paper to digital surveys allows us to upload and analyze the data almost instantly, as well as supports our sustainability efforts by doing away with the reams of paper necessary in administering the surveys in hard copy.
Although this switch to electronic delivery necessitated a few changes in the way we ask questions, at least five key survey questions have remained fairly constant over the past eight years: average time spent at the Festival; residence of visitors; ethnicity of visitors; how visitors found out about the event; and what they already knew, learned, and now wish to learn about the featured cultures.
1. Time Spent at the Festival
The average time spent at the Festival is a fairly short range over the past eight years: 65% of visitors spend an average of one to four hours at the Festival each year. However, a significant number of visitors, around 23%, spent more than four hours, some years indicating that they had spent, or intended to spend, more than six hours at the event.
Since various studies of different types of museums around the United States have resulted in an average of approximately two hours per visit, including at highly interactive museums such as science centers, the Festival seems to have a good record for holding visitors’ attention.
2. Visitor Residence
As expected, many of the Festival visitors come from within easy public transit or driving distance of the event. On average, approximately 68% come from the Washington, D.C., metropolitan area. The remaining 28% are not only from states within easy driving distance (Delaware, Pennsylvania, West Virginia, New Jersey, New York, North Carolina) but also from far-flung states (Florida, Texas, California, Alaska). Approximately 4% of visitors over the eight years are international, ranging from Guatemala to India, South Africa, and New Zealand.
3. Visitor Ethnicity
The ethnic makeup of visitors varies widely each year, roughly corresponding with the featured regions or countries. For instance, Latino visitors have averaged around 9% for the past eight years. However, during the years when a Hispanic/Latino culture was featured, such as in 2011 with the Colombia program, Latino visitors rose to 37%.
African American visitors over the years make up an average of 12% which reflects national census statistics but not the Washington metropolitan area’s African American population of 25.3%. Increasing outreach to African American communities in the area should be considered in the future. Asian visitors average 9% which is higher than the 2010 U.S. Census figures of 5.6%.
4. Learning about the Festival
Over the eight years of the survey, the ways in which visitors learn about the Festival have changed somewhat, but not dramatically. The most common forms of finding out about the Festival include previous Festival visits (31%), word of mouth (22%), and unplanned visits (21%). While one might assume that social media would have increased over the past several years, it has taken a surprising fall: 5% in 2011 when it was first offered as an option, 13.3% in 2012, 2% in 2013, and 1.05% in 2014. Newspaper as an information source has remained somewhat consistent, dropping from its highest point at 19% in 2007 to its lowest in 2014 at 8.92%, with an overall average of 13%.
5. Learning at the Festival
The survey question gauging learning at the Festival is asked in three parts for each of the featured programs: 1) What did you know about the culture before coming to the Festival? 2) What did you learn during the Festival? 3) How interested are you in learning more about or visiting the country after the Festival?
These questions are generally rated from “nothing” to “a lot,” and the answers tend to reflect the makeup of visitors as well as the relative “exotic” factor of the featured cultures. The response in 2008, for instance, revealed that 35% percent of people knew nothing about the people and cultures of Bhutan, as opposed to 9% knowing nothing about the music, food, and wine of Texas.
Gratifying for Festival organizers, the answers about what visitors felt they learned, and how much more they wish to learn, are consistently high: on average 45% respond that they learned “some” about the various cultures featured, and 58% respond in the affirmative that they wished to learn more or visit the featured country, state, or region after visiting the Festival.
*****
In future years, electronic analytics will continue to make comparing visitor responses to survey questions easier. Meanwhile, there are hundreds of comparisons and trends that one could deduce from the eight years of data we have accumulated.
If you are interested in further information about the results and trends of the Smithsonian Folklife Festival visitor survey, feel free to study this chart and make your own conclusions. We welcome discussion of the survey and its results, as well as suggestions for making it better in the future.
Betty Belanus is an education specialist, folklorist, and curator at the Center for Folklife and Cultural Heritage. Even after poring over the Festival visitor survey for weeks, she is still amazed at how many ways one could analyze the data.
Julia Aguilar Jerez served as an intern at the Center for Folklife and Cultural Heritage during the summer of 2014. She will be a senior at the University of California, Los Angeles, where she is studying ethnomusicology.


