Ever since I was a small child, I’ve loved maps. I’ve always been curiously mesmerized by their lines, patterns, and colors, and their magical ability to represent the richness and complexity of the real world within the confines of a sheet of paper or a computer screen. For the past quarter-century or so, I’ve been able to indulge that love by creating maps, first at National Geographic and most recently at Esri, the world’s leading provider of geographic information systems (GIS) software and services.
Some of my favorite maps are sprinkled with patterns of dots—points of color that might seem random but that can represent all sorts of things, from historical sites to fire hydrants, from boundary markers to polling locations. Some maps use dot densities to represent the distribution of features or phenomena, like income levels or ethnicity. And sometimes dots on a map can represent individuals.
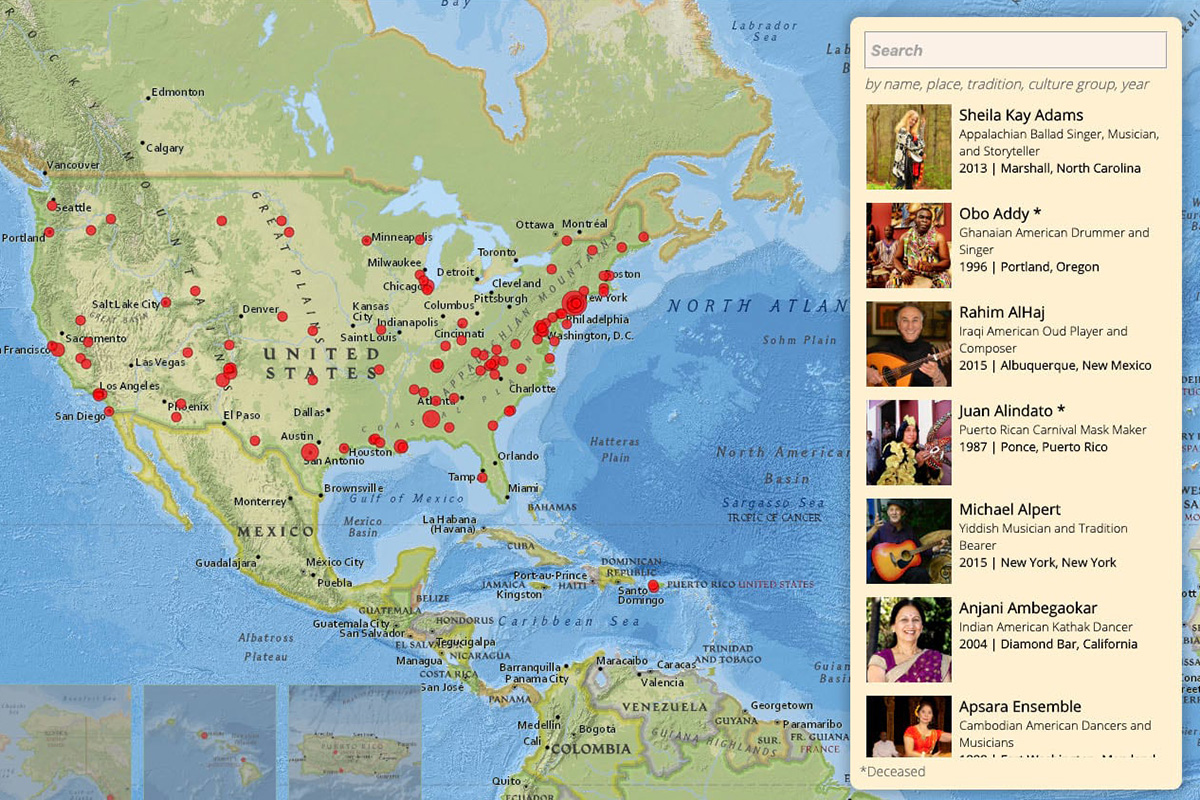
Several months ago, I had the pleasure of collaborating with Marjorie Hunt, a folklorist at the Center for Folklife and Cultural Heritage—who, in full disclosure, happens to be my wife—on a dot map of some very special human beings. Masters of Tradition: A Cultural Journey Across America, includes a story map that provides access to multimedia profiles of more than 100 National Heritage Fellows.
Since 1982, the National Endowment for the Arts has honored over 400 artists and craftspeople, recognizing outstanding individuals who represent and sustain a wide diversity of cultural traditions. They include Navajo basket makers, Japanese American drummers, African American quilters, Appalachian storytellers, Hawaiian hula masters, a Tlingit woodcarver, and an Iraqi American oud player. Within the map, you can find portrait images, photographs of objects, videos and audio of performances, and biographical sketches.


At Esri, I work with professionals who use GIS software to perform complex analyses that reveal relationships, show change over time, predict future trends, and facilitate infrastructure management. These professional mapmakers might be tempted to see the Masters of Tradition display as just “dots on a map”—a seemingly random pattern that’s not particularly revealing or insightful, and that provides few hints of a larger pattern. They might have suggested that we create a contour map of Heritage Fellow occurrence, or that we locate the artists against a polychrome background of predominant ethnic groups. But it’s likely that neither would have provided important additional insights, and both would have unnecessarily complicated a celebratory story.
Sometimes dots on a map are more than just dots on a map. In this case, the map, and its icons, provide a home base—a common ground—on which to convene an extraordinary group of cultural leaders and exemplars. Consider this scattering of dots as a glimpse at the endlessly rich tapestry of American culture, where each individual, each community, adds its own threads to the rich and varied fabric that is American life. Or, to employ another metaphor, we can imagine these dots as a tiny sampling of a vast pointillist painting, where every one of us represents a speck of color—a dot—across a spectrum of traditions that combine to create a whole that is far greater than the sum of its individual dabs of pigment.
That’s the magic at which the dots on this map hint: out of this dizzying variety of backgrounds and traditions emerges a uniquely American culture that’s enriched, not muddied, by diversity.
At a time when prejudice and fear of the unfamiliar are on the rise, these dots on a map are a reminder that there’s endless joy, beauty, and fun in diversity, and that our nation is strengthened by its immigrant communities—whether those immigrants arrived via an Ice Age land bridge, or crossed the Atlantic or the Rio Grande fleeing poverty and persecution, or endured unimaginable suffering in the hold of a slave ship. We hope you enjoy this cultural journey across America.

Allen Carroll is the founder of the story maps team at Esri. Previously, he worked at the National Geographic Society in a variety of positions, including art director of National Geographic magazine and chief cartographer.